
들어가며
쿠버네티스는 컨테이너화된 애플리케이션을 관리하고 배포하기 위한 플랫폼으로, 수 많은 Pod가 운용됩니다.
이렇게 수 많은 애플리케이션들을 안정성과 성능을 보장하기 위해서는 각각의 Pod들이 정상인지 주기적으로 모니터링하고 복구할 필요가 있는데, 쿠버네티스에서 이를 담당하는 것이 Kubernetes Container Probe입니다.
Container Probe 는 kubelet에 의해 주기적으로 수행되는 진단 장치이며, 진단을 수행하기 위해 컨테이너 안에서 특정 코드를 실행하거나 네트워크 요청을 전송합니다.
Container Probe
Check mechanisms
쿠버네티스 공식 문서를 살펴보면, 컨테이너 프로브를 사용하여 상태를 체크하는 방법은 총 4가지가 있습니다.
•
exec: 컨테이너에서 명령어를 실행
•
grpc: gRPC를 사용하여 Health check
•
httpGet: 지정한 주소, 경로로 HTTP GET 요청을 통해 응답 코드가 200~399 이면 성공으로 간주
•
tcpSocket: 특정 포트에 대해 포트가 활성화가 되어있는지 테스트
현재 업무에서는 대부분 백엔드 서비스 서버를 Pod로 띄우기 때문에, httpGet 체크 방식을 주로 사용합니다.
Container Probe 타입
컨테이너 프로브에는 세 가지 타입이 있습니다.
•
livenessProbe : 컨테이너가 정상인지 체크, 실패시 재시작
•
readinessProbe : 컨테이너가 트래픽 받을 준비가 됐는지 체크, 실패 시 트래픽을 받지 않도록 함
•
startupProbe : 컨테이너가 실행되었는지 체크, 실패시 재시작
Liveness Probe
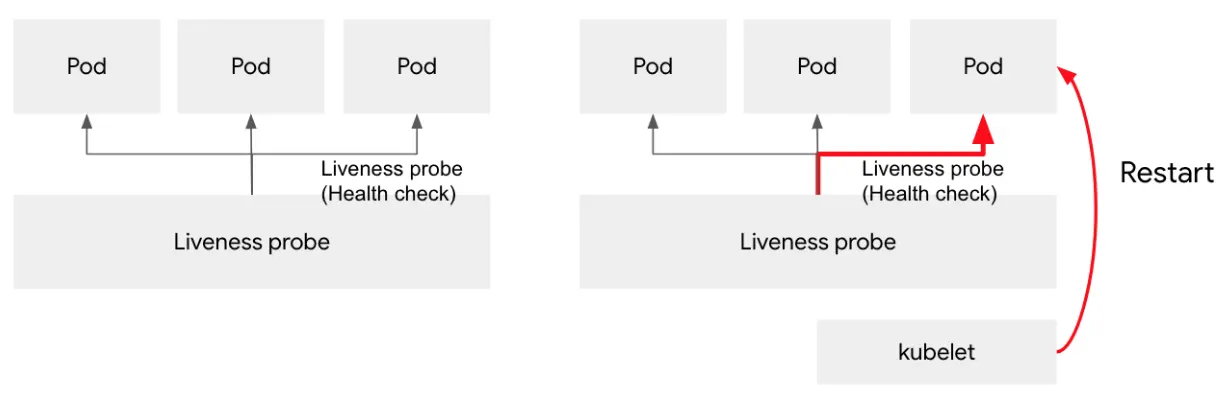
Liveness Probe 는 컨테이너가 현재 정상적으로 실행 중인지 여부를 확인합니다. 만약 liveness probe 가 실패한다면, kubelet은 컨테이너를 종료시키며, 해당 컨테이너는 재시작 정책에 따라 재시작 됩니다. 만약 컨테이너가 활성 프로브를 제공하지 않는 경우, 기본 상태는 Success 가 됩니다.
Liveness Probe 는 애플리케이션이 응답할 수 있는지(정상 응답이 아니더라도), 실행됐는지를 확인합니다.
예를 들면 Deadlock 과 같은 상태는 컨테이너는 겉보기에 아무런 문제가 없으나, 실질적으로 응답할 수 없는 상태입니다. Liveness Probe 는 이 상태를 확인하고 컨테이너를 종료하고 재시작하여 해결할 수 있게됩니다.
따라서 애플리케이션이 비정상일 때 재시작을 원하면 Liveness Probe 를 구성합니다.
그러나 Liveness Probe 는 자칫하면 컨테이너의 지속적인 재시작으로 오히려 가용성에 방해가 될 가능성도 있기 때문에, 충분한 검토를 통해 적용하는 것이 좋습니다.
Readiness Probe
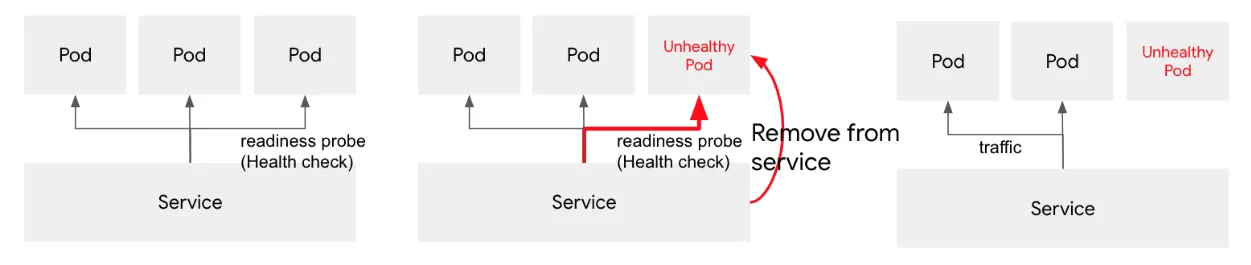
Readiness Probe 는 컨테이너가 요청을 처리할 준비가 되었는지 여부를 확인합니다. 만약 readiness probe 가 실패한다면, Endpoint Controller는 파드에 연관된 모든 서비스들의 엔드포인트에서 파드의 IP주소를 제거하여 트래픽이 전달되지 않도록 합니다. Readiness Probe 의 초기 지연 이전의 기본 상태는 Failure 이며, 만약 컨테이너가 이 프로브를 지원하지 않는다면, 기본 상태는 Success 가 됩니다.
Readiness Probe 는 컨테이너가 실제 요청을 처리할 준비가 되었는지 판단합니다.
예를 들면, 컨테이너가 정상적으로 응답할 수 있으나, DB등 외부 연동 서비스와 연결이 되지 않는 경우가 있습니다. 이 경우, 굳이 컨테이너를 재시작하는 것이 아니라 일시적으로 트래픽을 컨테이너로 보내지 않는 형태로 가용성을 보장합니다.
Startup Probe
Startup Probe는 컨테이너 내의 애플리케이션이 시작되었는지를 나타냅니다. Startup Probe 가 구성된 경우, 성공할 때까지 다른 나머지 프로브는 활성화되지 않습니다. 만약 스타트업 프로브가 실패하면, kubelet이 컨테이너를 종료시키고, 컨테이너는 재시작 정책에 따라 재시작 됩니다. 컨테이너에 스타트업 프로브가 없는 경우, 기본 상태는 Success 입니다.
Startup Probe 는 애플리케이션이 시작하는데 어느 정도 시간이 필요한 컨테이너에게 유용한 프로브 형태입니다.
Liveness Probe vs Readiness Probe
Liveness Probe와 Readiness Probe는 아주 유사하게 동작하지만, 목적이 다릅니다. Liveness Probe는 애플리케이션의 생존 여부를 체크하고, 장애가 발생한 것으로 판단되면 애플리케이션을 다시 시작합니다.
Readiness Probe는 애플리케이션이 준비된 상태인지 여부를 체크하고, 준비되지 않은 상태에서는 트래픽을 받지 않도록 설정합니다.
즉, Liveness Probe는 애플리케이션의 정상 상태를 체크하고, Readiness Probe는 애플리케이션이 트래픽을 받을 준비된 상태인지를 체크합니다.
Configure Probes
각 Probe는 보다 정확한 health 체크를 위해 여러가지 설정 필드를 가지고 있다.
apiVersion: v1
kind: Pod
metadata:
name: probe-pod
spec:
containers:
- name: my-container
image: my-image
livenessProbe:
httpGet:
path: /__health-liveness
port: 8080
initialDelaySeconds: 30
periodSeconds: 10
readinessProbe:
httpGet:
path: /__health-readiness
port: 8080
failureThreshold: 3
# -- Number of seconds after the container has started before [probe] is initiated
initialDelaySeconds: 5
# -- How often (in seconds) to perform the [probe]
periodSeconds: 10
# -- Minimum consecutive successes for the [probe] to be considered successful after having failed
successThreshold: 1
# -- Number of seconds after which the [probe] times out
timeoutSeconds: 1
YAML
복사
•
httpGet : 컨테이너의 liveness/readiness 체크를 수행할 때 사용되는 HTTP GET 요청을 정의합니다.
◦
path : probe를 호출할 경로를 지정합니다.
◦
port : 컨테이너 내부에 probe 호출에 사용될 포트 번호를 지정합니다.
•
initialDelaySeconds: Pod가 생성되고 Container가 시작된 이후 최초 probe가 수행되기 전 Delay를 주는 시간, default=0
•
periodSeconds: probe의 수행 주기 설정, 이 값은 timeoutSeconds 보다 커야함, default=10
•
timeoutSeconds: probe 수행 응답을 기다리는 timeout 시간 설정 default=1
•
successThreshold: probe가 최소 몇번을 성공해야 성공으로 마킹할 것인지 설정하는 필드 default=1
•
failureThreshold: probe가 최소 몇번 실패해야 실패로 마킹할 것인지 설정하는 필드 default=3
적용 및 테스트
Container Probe의 구성은 비슷하고, 동작에서만 약간씩 차이가 있디 때문에 테스트에서는 Readiness Probe만 테스트하도록 하겠습니다.
실제 서비스를 운영할 때 Liveness Probe보다는 Readiness Probe를 설정하는 것이 더 중요합니다.
그 이유는 기본적으로 Process가 Deadlock등의 상태에 빠지지 않고 에러를 발생시키면 자동적으로 Pod가 재시작 시켜주기 때문입니다.
따라서 Pod의 재시작을 목적으로 Liveness Probe를 사용하는 것은 상당히 잘못된 사용이라고 하며, 만약 애플리케이션에서 알 수 없는 에러등이 발생하면 Crash가 발생하도록 두는게 좋습니다. (Let it crash)
실제로 Liveness Probe에 대해서 찾다보면 사용의 위험성에 대한 내용들을 심심치 않게 발견할 수 있으실 겁니다.
Readiness Probe 구성
아래 사용된 Spring App에는 Spring Actuator 를 통해서 Readiness endpoint를 활성화하고 사용중입니다. 여기에 사용된 Spring App은 추후 Github로 공유하도록하겠습니다.
해당 spring app의 readiness probe는 같은 namespace에 배포된 mysql의 연결상태를 체크하도록 구성되어 있습니다.
deployment.yaml
apiVersion: apps/v1
kind: Deployment
metadata:
name: springapp
spec:
replicas: 1
revisionHistoryLimit: 1
selector:
matchLabels:
app: springapp
# -- Configure Deployment Strategy (Rolling Update)
strategy:
type: RollingUpdate
rollingUpdate:
maxSurge: 1
maxUnavailable: 0
template:
metadata:
labels:
app: springapp
spec:
containers:
- name: springapp
image: <image_url>
imagePullPolicy: Always
ports:
- containerPort: 8080
name: http
# -- Configure Readiness Probe
readinessProbe:
# -- Minimum consecutive failures for the [probe] to be considered failed after having succeeded. The default is 3.
failureThreshold: 3
httpGet:
path: /actuator/health/readiness
port: 8080
scheme: HTTP
# -- Number of seconds after the container has started before [probe] is initiated. The default is 0.
initialDelaySeconds: 10
# -- How often (in seconds) to perform the [probe]. The default is 10.
periodSeconds: 10
# -- Minimum consecutive successes for the [probe] to be considered successful after having failed. The default is 1.
successThreshold: 1
# -- Number of seconds after which the [probe] times out. The default is 1.
timeoutSeconds: 1
# -- Configure container lifecycle hook for graceful shutdown
lifecycle:
preStop:
exec:
command: [ "/bin/sh","-c","sleep 10" ]
terminationGracePeriodSeconds: 30
YAML
복사
service.yaml
apiVersion: v1
kind: Service
metadata:
name: springapp
namespace: ns-play
spec:
ports:
- name: http
port: 8080
protocol: TCP
targetPort: 8080
selector:
app: springapp
type: ClusterIP
YAML
복사
Readiness Probe 동작 테스트
정상 상태
mysql이 정상적으로 실행되고 있을 때, spring app 역시 1/1 Running 로 정상인 것을 확인할 수 있습니다.
이때 readiness endpoint의 응답은 다음과 같습니다.
HTTP/1.1 200
{
"status": "UP",
"components": {
"db": {
"status": "UP",
"details": {
"database": "MySQL",
"validationQuery": "isValid()"
}
}
}
}
JSON
복사
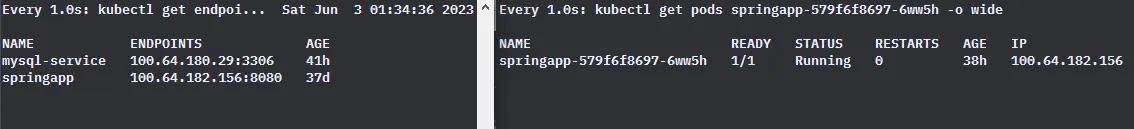
mysql Pod 종료
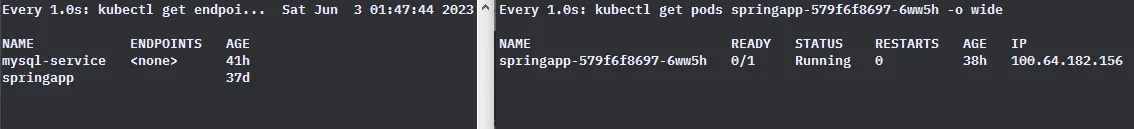
mysql pod를 종료하자, mysql-service의 endpoint가 사라진 것을 확인할 수 있습니다.
이때 readiness endpoint의 응답은 다음과 같습니다.
HTTP/1.1 503
{
"status": "DOWN",
"components": {
"db": {
"status": "DOWN",
"details": {
"error": "org.springframework.jdbc.CannotGetJdbcConnectionException: Failed to obtain JDBC Connection; nested exception is java.sql.SQLTransientConnectionException: HikariPool-1 - Connection is not available, request timed out after 1000ms."
}
}
}
}
JSON
복사
mysql에게 접속할 수 없기 때문에 readiness probe 가 다음과 같이 실패하게되고, failureThreshold 만큼 연속 실패한 후 0/1 Running 상태로 전환됩니다.
이때, spring app 서비스에 연결된 endpoint를 확인하면 100.64.182.156 Pod IP가 사라진 것을 확인할 수 있습니다.
즉, Readiness Probe를 실패하면 서비스의 endpoint가 제거되면서 트래픽이 Pod로 전달되지 않게 됩니다.
mysql Pod 재실행
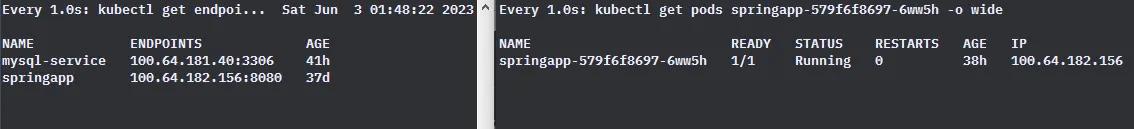
mysql pod를 재실행하여 mysql과의 연결이 확인되어 readiness probe가 다시 정상 응답을 하게 됩니다.
이제 spring app이 1/1 Running 상태로 돌아오며, 서비스의 endpoint에 다시 spring app의 Pod IP가 등록된 것을 확인할 수 있습니다.
마치며
Kubernetes Container Probe는 컨테이너화된 애플리케이션의 Health를 체크하고, 장애 상황을 빠르게 감지하여 대처할 수 있는 도구입니다.
Liveness Probe는 애플리케이션의 정상 여부를 체크하고, Readiness Probe는 애플리케이션이 준비된 상태인지 여부를 체크합니다.
이 두 가지 프로브는 애플리케이션의 가용성을 보장하지만, 실제로는 파드가 재시작되거나, 트래픽을 전달하지 않기 때문에 자칫하면 오히려 가용성을 떨어뜨릴수도 있습니다.
Caution: Liveness probes can be a powerful way to recover from application failures, but they should be used with caution. Liveness probes must be configured carefully to ensure that they truly indicate unrecoverable application failure, for example a deadlock.
Note: Incorrect implementation of liveness probes can lead to cascading failures. This results in restarting of container under high load; failed client requests as your application became less scalable; and increased workload on remaining pods due to some failed pods. Understand the difference between readiness and liveness probes and when to apply them for your app.
따라서 면밀한 검토를 통해 애플리케이션에 맞게 꼭 필요한 프로브만 사용하거나, 적절하게 값을 설정하는 것이 필요합니다.